The Spatial Data Framework gives governments and organisations a single, open-source platform to combine globally available datasets with their own local data — turning fragmented social, economic and environmental data into decision-ready reporting.
This is open-source data infrastructure that can be adapted for different use cases — for both sources and outputs. Every source, calculation, and transformation is fully traceable, verifiable, and reproducible.
The Spatial Data Framework provides shared infrastructure for an organisation's data analysis and reporting. It combines globally available datasets with national or local data, and keeps the full working visible — every source, calculation, and transformation is transparent, traceable, and reproducible. This means that the presentation can be customised, the evidence can be verified and decisions defended when required.
One platform, multiple data sources —
complete working shown
The SDF is an open-source infrastructure layer that ingests, processes, and connects data across types — spatial layers, administrative records, survey observations, economic statistics, and financial data — whether sourced globally or from your own organisation. Outputs are built from a modular interface and can use templates for common reporting functions such as ocean accounts and SDG reporting.
Why it matters
Countries need reliable ocean and ecosystem accounts to manage marine resources, access climate finance, and report against SDG commitments. But producing these accounts requires bringing together satellite imagery, field surveys, and administrative data from multiple agencies — and doing so in a way that is transparent, reproducible, and trusted.
For coastal and ocean states — from small islands to large maritime nations — the stakes are immediate. Ocean accounts directly inform decisions about fisheries management, coastal protection, and sustainable livelihoods — decisions that affect food security, economic resilience, and access to climate finance. Getting these numbers wrong, or being unable to defend them, has real consequences for communities and for national policy.
The Spatial Data Framework provides shared infrastructure so that countries are not each building bespoke systems from scratch. Funded through a UK Government international development partnership, the SDF gives the agencies responsible — across environment, statistics, finance, and planning — a common foundation for producing accounts they can stand behind.
What it does
The SDF is an aggregator and orchestrator, not a data producer. It ingests datasets from authoritative sources — satellite observation programs, national statistics offices, line ministries, research institutions — and processes them through standardised pipelines that capture provenance at every step.
Because it governs data centrally rather than generating it, the SDF can feed multiple outputs tailored for different audiences: dashboards for ministers, analytical workspaces for statisticians, data portals for researchers, and public transparency reports — all from the same trusted, provenanced data.
Global datasets.
Local context.
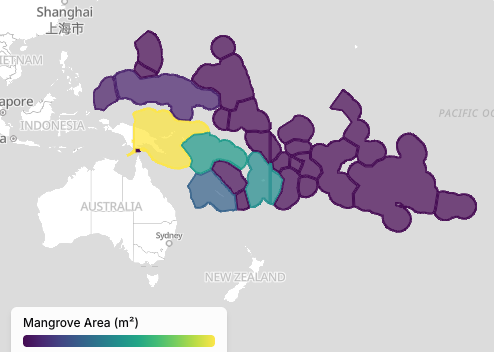
The platform connects pre-loaded global spatial datasets — EEZ boundaries, mangrove extent, seagrass distribution, coral reef coverage — with national and sub-national data uploaded by the user organisation. Layers can be combined, compared, or used independently within a single workflow.
Every number.
Full working shown.
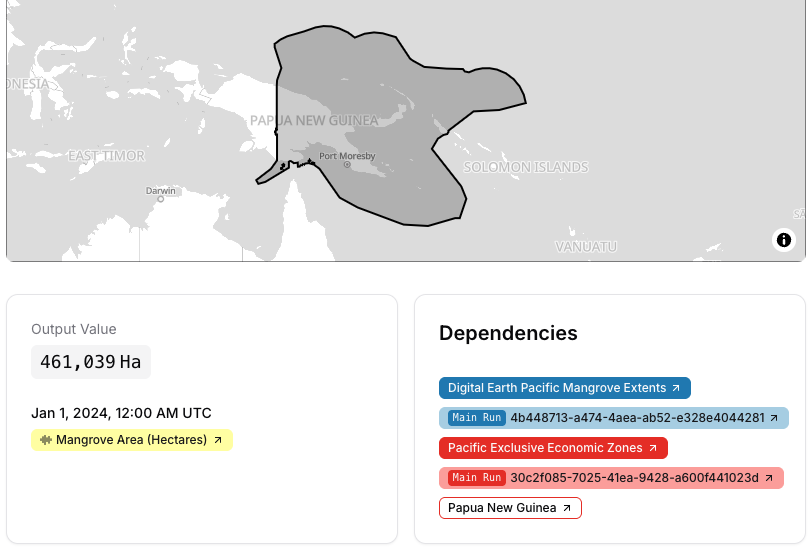
The SDF logs every step between raw data and final figure. Each source, transformation, and methodological choice is timestamped and stored alongside the output — so any number in a report can be traced back to its origin, and any analysis can be replicated or audited independently.
The SDF does not just display results — it preserves the complete chain of evidence that produced them.
Customisable outputs.
Template-ready reporting.
Outputs can be built from scratch or drawn from templates for common reporting frameworks — ocean accounts, SDG reporting, national environmental-economic accounting. Each component of a template signals whether the required data exists to populate it.
| Indicator | Value | Unit | Source | Verified |
|---|---|---|---|---|
| Mangrove extent | 142,800 | ha | GMW v3 | ✓ |
| Carbon stock (mangrove) | 4.2 | Mt CO₂-e | IPCC Tier 1 | ✓ |
| Seagrass extent | 38,400 | ha | Global atlas | ✓ |
| EEZ area | 1,340,000 | km² | Natl. survey | ✓ |
| Fish catch (total) | — | t/yr | Data gap | – |
Verified outputs.
Auditable evidence.
The admin console gives technical users and administrators full control over data workflows, user permissions, and indicator lifecycles. Every value produced by the SDF carries a data passport — a self-contained, machine-readable provenance record that documents the complete chain from source data through processing to final output.
For stakeholders issuing verified reports or certificates — whether for climate finance instruments, SDG reporting, or national ecosystem accounts — the data passport answers "where did this number come from?" with verifiable evidence, not assertions. Each passport can be independently inspected, shared, and audited.
One foundation, many outputs
The SDF is shared infrastructure that feeds dashboards, reports, data portals, and APIs — each tailored for its audience, all backed by the same governed data.
Value-level provenance
Every output number links to the specific source observations, processing code version, boundary set, and approval decisions that produced it. Not dataset-level metadata — individual value traceability.
Multi-ministry federation
Organisation-scoped data with approval gates across ministries. Environment, fisheries, statistics, and meteorology each control their data while contributing to consolidated national accounts.
Composable indicators
Derived metrics compose from base indicators with full dependency tracking. When an upstream value changes, every downstream indicator — percent coverage, condition scores, SDG metrics — knows it needs recalculation.
Data passports
Self-contained provenance documents that travel with every quantitative claim. Machine-readable and human-inspectable — any number in a report can be independently verified back to source data.
QA/QC lifecycle
Governed status workflow from draft through review to approved and published. Every state transition is attributed, timestamped, and auditable.
Cloud-native processing
Dask parallel compute, Apache Sedona spatial SQL, and PostGIS at scale on AWS EKS. Argo Workflows orchestrate DAG-based pipelines with provenance sidecar output at every processing stage.
Who uses the SDF
The framework serves different needs across the data lifecycle — from the minister presenting national accounts to the analyst reproducing a methodology.
Decision Makers
Verifiable reports ready to present — every number traceable to its source.
- ✓ Data results with full provenance
- ✓ Structured report compilation
- ✓ Export as PDF or styled HTML
- ✓ Provenance communicates data quality
Analysts
Consolidated dashboards with provenance — scope, delegate, and present with confidence.
- ✓ Custom dashboards for stakeholders
- ✓ Scoping and delegation workflows
- ✓ Consolidated multi-source views
- ✓ Provenance at every aggregation level
Data Providers
Format flexibility and proper credit — contribute data and see it used with attribution.
- ✓ Clear format guidance and upload process
- ✓ DOI and citation tracking
- ✓ Data component availability templates
- ✓ Public and proprietary access controls
Research & Technical
Custom pipelines with full reproducibility and transparent methodology.
- ✓ Custom dashboards with provenance
- ✓ Every processing step reproducible
- ✓ Derived data products
IT & Infrastructure
Observability, compliance verification, and policy-aligned deployment.
- ✓ Processing logs and failure visibility
- ✓ IT policy compliance assessment
- ✓ Provenance for audit and governance
App Administrators
Documentation, onboarding support, and usage evidence for less technical colleagues.
- ✓ Benefits and security documentation
- ✓ Open-source maintainability assessment
- ✓ Guided onboarding and first workflows
Auditors
Verification and lineage tracing for commissioned or public-good auditing.
- ✓ Trace figures to source data and methodology
- ✓ Consolidated audit targets across datasets
- ✓ Shareable evidence for verification
Civil Society
Transparency and sense-checking for lawyers, researchers, journalists, and advocates.
- ✓ Shareable URLs recreating any query
- ✓ Plain-language methodology summaries
- ✓ Independent statistics verification
Open source repositories
The SDF is built as three open-source codebases — a Python processing toolkit, a full-stack TypeScript application, and a configurable dashboard template. Explore the code, run it locally, or contribute.
Processing Toolkit
csdr-cloud-spatial
Cloud-native geospatial data processing and workflow automation. Supports spatial data ingestion, transformation, indicator calculation, and output with provenance tracking for reliable and repeatable results.
Web Application
csdr-cloud-spatial-app
Full-stack application for managing spatial data workflows, building dashboards and reports, and governing indicator lifecycles. Includes the API, database schema, and interactive frontend with spatial visualisation.
Dashboard Template
goap-oa-dashboard-template
A generic, configurable web application for displaying ocean accounts data. All functionality is data-driven through JSON configuration — no code changes required for new country deployments. Includes spatial mapping, charts, and monitoring sites.
Demos
See the SDF in action — from managing data through the admin console to publishing dashboards and connecting via API.
Technical Demo
Admin console walkthrough
Walk through the SDF's admin console, data workflows, and API — from adding datasets and geometries to publishing dashboards and generating API keys.
Dashboard Builder
Build and publish reports
Build custom dashboards from your data and products with drag-and-drop templates — maps, charts, and tables in a single shareable view.
Accounting & Reporting
Ocean accounts & SDG reporting
Generate auditable ocean accounts and SDG reports backed by full provenance — every figure traceable to its source data and methodology.
Built in the open
The SDF is being actively developed in collaboration with GOAP member countries, with early adoption underway with interested members. The framework grows out of real production needs — not abstract design — and evolves as countries begin compiling their first ocean accounts.
The project is open source and welcomes collaboration: whether you are adopting the framework for your own national accounts, contributing data pipelines, or helping shape the protocol. If your country or organisation is working on ocean or ecosystem accounting, we would like to hear from you.
Deployment and access control
The SDF is designed to be deployed as sovereign infrastructure — run and controlled by the country or organisation that owns the data. This is especially important when country-specific or sensitive datasets are in scope: the platform runs on infrastructure you govern, not as a hosted service managed by a third party. Data residency, access policies, and operational control remain with the deploying institution.
At the same time, GOAP actively facilitates deployment, ongoing development, and cross-country collaboration. For work with public and open-access datasets — global satellite observations, shared indicator frameworks, and open methodologies — GOAP provides shared environments, technical support, and coordination so that countries are not working in isolation.
User access control is built into every layer of the platform. The SDF uses a multi-tenant model where each organisation manages its own data, users, and visibility settings. Four tiered roles — platform administrator, organisation admin, creator, and viewer — govern who can ingest data, build reports, or read outputs. Visibility controls determine whether resources remain private to an organisation or are published for wider access, with dependency validation ensuring that reports cannot be made public unless their underlying data sources are too. These controls apply consistently across the admin console, dashboards, and API.
Get started with the SDF
The Spatial Data Framework is open source and actively developed with GOAP members. Explore the documentation, browse the code, or get in touch to discuss adoption, collaboration, or contribution.